Free node telemetry service
Node telemetry
Algorand Algod node has built in telemetry mechanism that sends important events, errors and metrics to a chosen telemetry service.
By default telemetry sending is disabled. Once enabled telemetry is sent to Algorand Technologies operated service and used for network diagnostics.
Operating system support
Make sure you have your node setup using one of the tools/guides below.
| Node/OS | Mac | Linux | Windows |
|---|---|---|---|
| Nodekit.run | + | + | - |
| FUNC | + | + | Video guide |
| OG Install | + | + | - |
| Docker | + | + | - |
Check out the Quick Setup section of this documentation once you have your node set up.
Nodely Telemetry highlights
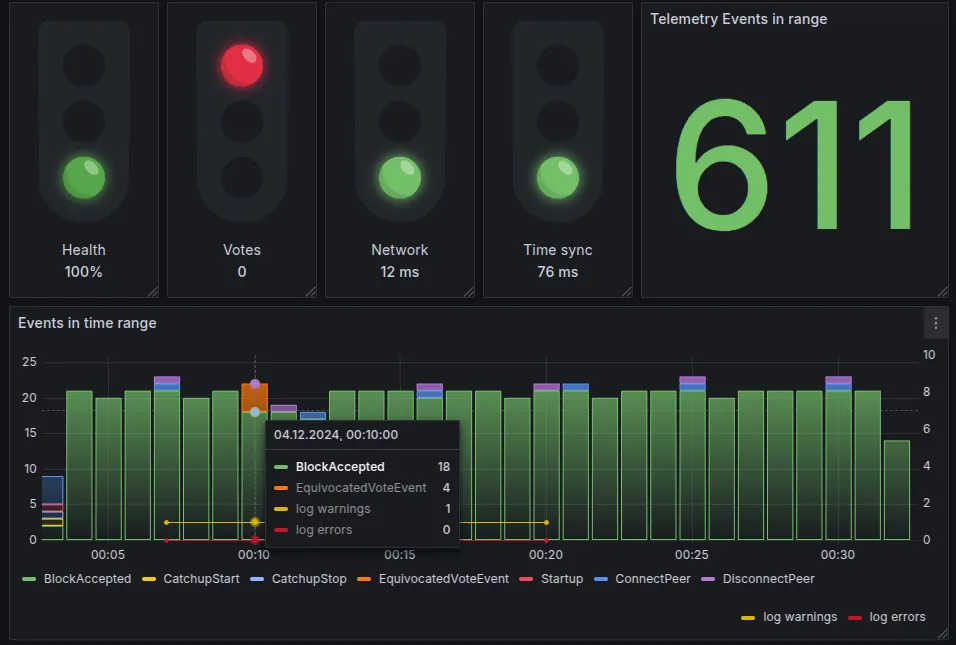
- Key metrics :
- Health (overall score based on other metrics)
- Voting performance
- Network performance
- Synchronization issues
- Telemetry events
- HeartBeats with internal metrics
- Warnings and Errors
- Leader boards
Individual telemetry
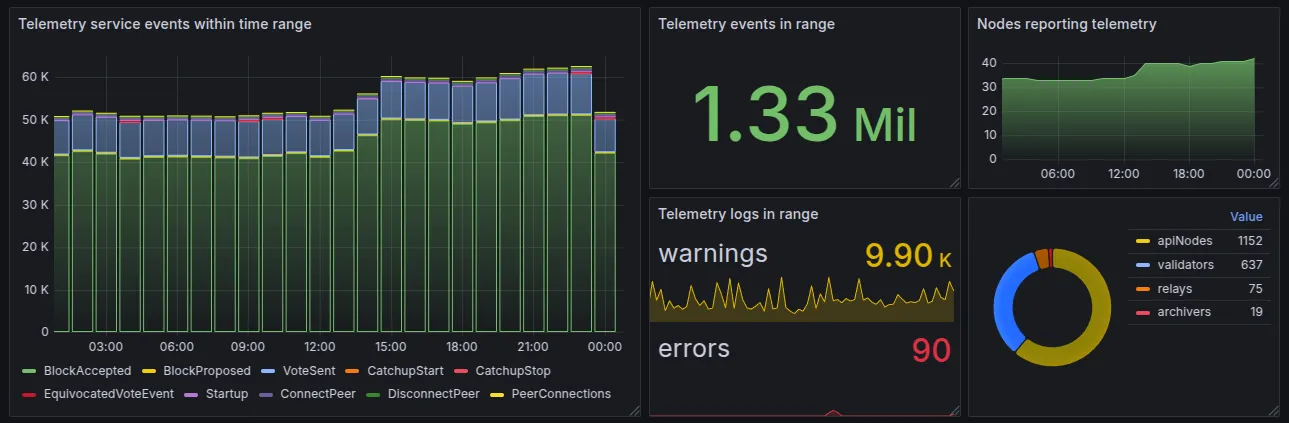
Global telemetry
You can compare your node to others on the global dashboard https://g.nodely.io/d/telemetrymain
Quick Setup
OG install
Below instruction will work only on default node install via package manager or updater scrips.
If your Linux/Mac node is installed with package manger or updater script just execute the following commands to make you node start sending telemetry to the service.
  # set telemetry endpoint to Nodely  sudo diagcfg -d /var/lib/algorand telemetry endpoint -e https://tel.4160.nodely.io
  # anonymize node name in telemery (do not leak hostname)  sudo diagcfg -d /var/lib/algorand telemetry name -n "anon"
  # Or you can make your name public by prefixing it with @  # sudo diagcfg -d /var/lib/algorand telemetry name -n "@MyPublicNodeName"
  # enable telemetry  sudo diagcfg -d /var/lib/algorand telemetry enable
  # restart your nodes  sudo systemctl restart algorand
You might need to provide -d folder parameter where folder is the location of your node’s data folder.
- Note the random node id (GUID) returned by the first command
- Restart you node for settings to take effect.
- Go to the temporary dashboard and enter your node’s GUID to check out the stats
- You can also visit https://g.nodely.io/d/telemetry/?var-GUID=$nodeid (replacing $nodeid with your GUID) to go to your node’s stats directly.
Func node
- Version 3.0 or later of FUNC has built-in telemetry support
Just enable it on the main screen and use the link next to the Telemetry label to go to your private dashboard.
You might need to restart your node if there is no telemetry on the dashboard after a minute.
A1CN
- Version 1.6.0 or later hast built-in telemetry support
Just enable Nodely telemetry and a link to your personal telemetry dashboard will appear.
You might need to restart your node if there is no telemetry on the dashboard after a minute.
Nodekit.run
# set telemetry endpoint to Nodely
user@node:~$ ./nodekit telemetry enable nodely
███    ██  ██████  ██████  ███████ ██╗  ██╗██╗████████╗████   ██ ██    ██ ██   ██ ██      ██║ ██╔╝██║╚══██╔══╝██ ██  ██ ██    ██ ██   ██ █████   █████╔╝ ██║   ██║██  ██ ██ ██    ██ ██   ██ ██      ██╔═██╗ ██║   ██║██   ████  ██████  ██████  ███████ ██║  ██╗██║   ██║                                   ╚═╝  ╚═╝╚═╝   ╚═╝

   Overview
  Nodely Telemetry is a free telemetry service offered by a third party (Nodely)  Enabling telemetry will configure your node to send health metrics to Nodely
  │ Privacy note: Information about your node (including participating accounts  │ and approximate geographic location) will be associated with an anonymous user  │ identifier (GUID.)
  │ Tip: Keep this GUID identifier private if you do not want this information to  │ be linked to your identity.
  Nodely Telemetry Documentation https://nodely.io/docs/public/telemetry/
  Do you want to enable telemetry with the Nodely provider? (y/n)
(Press Y)
WARN (You may be prompted for your password)DEBU Running: sudo /home/bit/nodekit configure telemetry -d /var/lib/algorand --enable --name anon --endpoint https://tel.4160.nodely.ioINFO Telemetry enabled. To see your Nodely dashboard URL, run:./nodekit telemetry status
user@node:~$ ./nodekit telemetry status
Telemetry is EnabledProvider: NodelyNode name: anonTelemetry GUID: aaaaaaaa-bbbb-cccc-dddd-eeeeeeeeeeeeTelemetry Endpoint: https://tel.4160.nodely.ioNodely Dashboard URL: https://g.nodely.io/d/telemetry/node-telemetry?var-GUID=aaaaaaaa-bbbb-cccc-dddd-eeeeeeeeeeeeOfficial docker
Official docker disables telemetry unless TELEMETRY_NAME env var is defined.
So launch your docker container with TELEMETRY_NAME=anon after you enter the container and setup the telemetry
# set telemetry endpoint to Nodely diagcfg -d /algod/data telemetry endpoint -e https://tel.4160.nodely.ioRemember to restart container with TELEMETRY_NAME=anon (or your own name prefixed by @ character) once you setup the telemetry endpoint from within the container.
Target audience
Telemetry service is designed for any kind of Algorand mainnet node.
- Validator nodes
- API nodes
- P2P Nodes and Relays
Data collected
- Node geolocation down to country level
- Node version and 10 minute metrics snapshots
- Telemetry logs including validator’s public address
- Nodely reserves the rights to prune data of nodes inactive for over a week
GDRP / Privacy
- Nodely Telemetry service does not collect PI data.
- Collected dataset is available publicly in context of node’s random unique identifier
- Node’s UUID can be reset at any time by node operator
Pricing
- Node performance data collection and charting is a free, public service.
- API access is part of the Nodely Analytics tier only.